
City's attendances, home and away, past, present and future
Home Attendances
In late 2024, with City’s current resurgence, just how many supporters could City attract on a regular basis?
City were founded in 1922 and spent we spent our first 10 seasons playing at Fulfordgate, about 3 miles to the southeast of the city centre and accessible by public transport by one tram line. It wasn’t easy (or quick) to get to the ground.
In 1932, the directors felt to grow the club, it needed to move to a more central location in York. From first thoughts to first game, it took about 6 months.
Bootham Crescent City’s home until 2021 when the move to Monks Cross was finally completed. That move was about 20 years in the making, given Douglas Craig’s sale, the council shenanigans, build issues and covid.
Bootham Crescent had become a millstone, landlocked, there was no space to expand (various plans had been floated over the years, including buying the barracks behind the Popular Stand, Shipton Street school, a double decker Grovsenor Terrace stand and even turning the pitch through 90 degrees).
In our Football League times, City have had a history of home crowds below the average for the division in which we were competing.
Indeed, since 1958 and the end of regionalised football, City’s average home crowd has only exceeded our division’s average in 8 (out of 50) seasons in which we have been in the Football League. 4 of those seasons corresponded to promotion (1964/5, 1970/1, 1973/4 and 1983/4) whilst we also achieved that feat in 4 successive seasons under Denis Smith (1982-6).
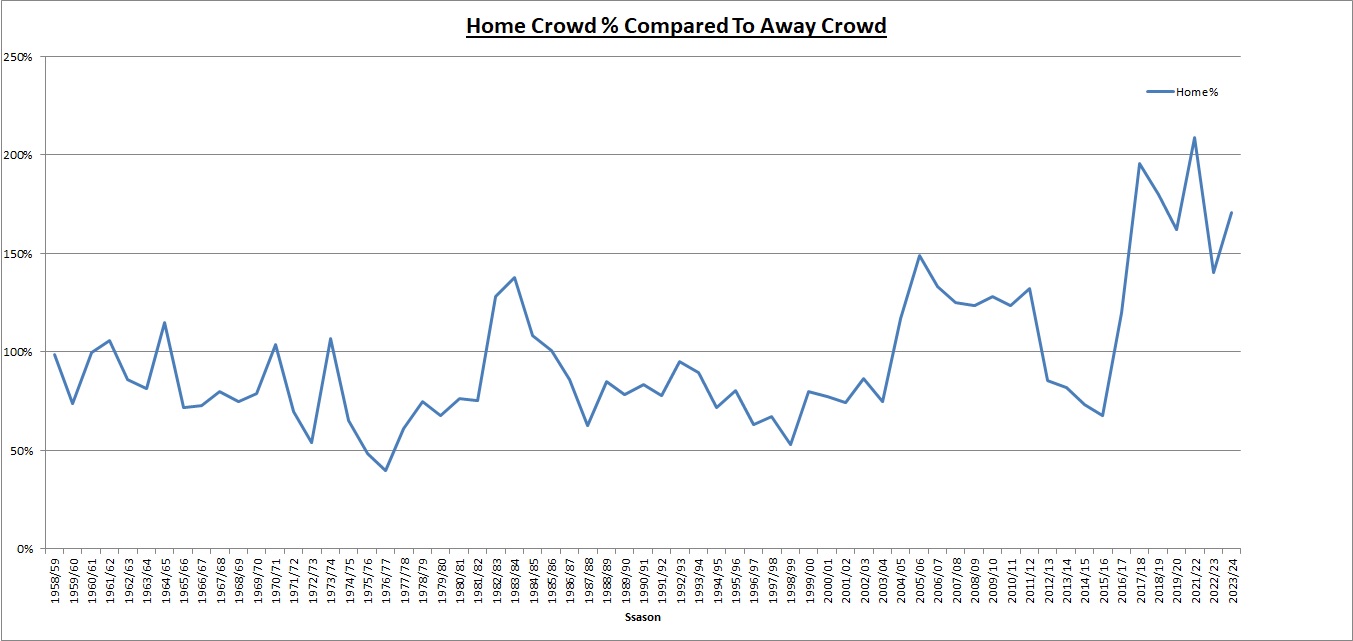
Chart showing City’s home league attendances by season expressed as a % of the away game attendances. Anything less than 100% means City’s away games attracted a bigger crowd than City’s home games. Note the number of seasons where our home game attendances have exceeded away gates. Basically, promotion and non league seasons. Note 20201/2, our NLN play off season where more than twice as many fans saw City’s home games compared to away games and conversely, 1976/7,when twice as many saw City’s away games compared to home games.
Maybe unsurprisingly, 1984 was the season we recorded our highest home aggregate attendance when compared to our away games, home gates were 137% of away attendances with 115,175 showing our home games and only 83,504 watching our away games.
Conversely, twice our home crowds have been less than half the away gates, 1975-7, 2 consecutive relegation campaigns under Wilf McGuinness.
Since 1958, in terms of turnstile clicks, only in 1974/5 (8,124) and 1958/9 (8,828) have home crowds topped 8,000. In only 5 more seasons has the home average been over 6,000.
Going back even further, the golden era for football crowds was the late 1940s although City’s attendances peaked in the first half of the 1950s with our Happy Wanderers team.
In 6 seasons between 1948 and 1957, City’s average crowd topped 8,000, peaking at a highest ever average of 10,409 (total 218,559 in 21 games) during the 1948/9 season, although with an expansion of the Football League and 2 extra games, 236,685 fans passed through the Bootham Crescent turnstiles during the 1955/6 season.
In that era, with home games on consecutive days on Good Friday / Easter Saturday 1955, 2 home games saw over 32,000 fans pass through the overworked Bootham Crescent turnstiles.
Our all time lowest Football League average home gate was 2,102 during the 1977/8 season with 2 more seasons when we have seen an average of under 2,500 (the seasons 1980-2).
During the 2007/8 season, 2,258 was the lowest home average attendance during our recent non league days. In the 2004-12 years our non league average failed to breach 2,500 during another 3 seasons. 30/April/2016 saw a suspiciously rounded 2,000 Bristol Rovers fans at Bootham Crescent as they celebrated promotion from the bottom tier as City exited in the other direction. Before them, Burnley and Hull would regularly bring large away following to Bootham Crescent.
2,501 was the 2018/9 season average and has been our lowest average in our second non league era.
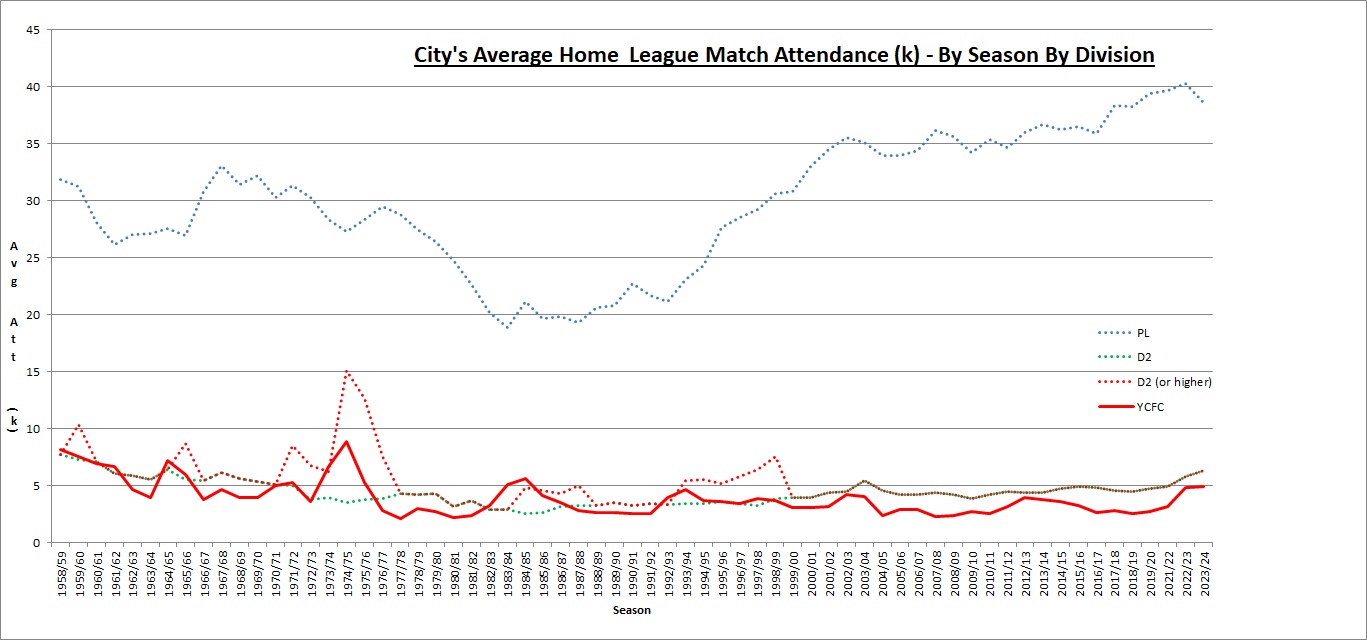
The dotted blue line at the top of the chart shows the average top flight attendance by season. The solid red line shows City’s average attendance by season. For comparison, a dotted green line (“D2”) shows the average Division 2 (basement) seasonal attendance and closely follows the dotted red line (“D2 (or higher)”) which shows average seasonal attendance in the league City were in when above Division 2. Note, the solid red line shows City rarely have attendances above the Division 2 average (promotion seasons excepted).
A recent trend has been to report the number of away fans in the ground and whilst not always accurate (and sometimes not available), they provide an insight into City’s current support base.
Last season (2023/4), our average home gate was 4,857. By comparison, our away games averaged 2,850 fans. In numbers, 111,705 compared to 65,543. Each LNER game was watched by an average of 435 of away supporters, nearly one quarter were those attending the Chesterfield game. Every City away game saw an average 496 City supporters, including those long midweek away trips to the likes of Oxford City and Dagenham. At LNER, away fans made up 8.9% of the crowd whilst City’s away following made up 17.4% of the attendance.
However, last season’s aggregate home attendance was barely one half of our best ever home attendance. How times have changed.
This season (
2024/5), including the Barnet game, our 8 home matches have seen 42,899 fans in attendance, if we maintain that average over the season, over 123,000 will see City at the LNER.
Undoubtedly, the move to LNER has seen a big increase in attendances.
The first half of the 2021/2 season, our first at LNER saw an average of 2,856 attend the first 11 games cumulating in the Bradford PA debacle, as John Askey turned around our fortunes, the last 10 league games attracted an increased average of 3,401. The 2 end of season play off wins attracted an average of 6,921 fans. I think that demonstrates the appeal of a successful side. Moving on, a much more united club with a feelgood factor has certainly also helped to attract fans back to the club.
It begs the question, is the LNER big enough?
A major consideration is the ground’s configuration and the need to accommodate away supporters. Away demand varies from the handfuls of those distant teams to the 2,000+ from Chesterfield and slightly less numbers from other local rivals.
Promotion might mean that teams like Bradford and Doncaster would regularly bring 4 figure followings with them.
That said, during the 2023/4 season, the Division 2 average gate was 6,220 and in Division 1 it was 9,814. That said, given City’s historic low crowds, it could be said that the LNER is just about big enough for the years to come.
At different times, I’ve heard that the North Stand could easily be extended and I assume the corners could be “filled in” to up the capacity. I’m no architect so won’t guess by how many seats or how much it might cost.
Maybe a ground extension might even re-ignite the safe standing debate.
At the end of the day, whether the LNER is big enough, might depend on whether City are successful or not. Some of last season’s increased attendance was driven by some cheap tickets and very active marketing whilst this season’s increase has been driven by successful start to the season.


Away Dayz
Overview
The reporting of away fan attendance at games is a relatively recent phenomenon. For league games, with 2,225 (56.1%, match attendance was 3,961) away fans, City’s following at FC Halifax in October 2024 was City’s biggest ever officially reported away league game following. It goes without saying that City's following was the biggest away following of the day in the league, but also bigger than the away following combined at the 11 other NL games and bigger than match attendance at 6 NL games on the day. In the 3 divisions of the Football League, only Leeds, Stoke, Hull and Wrexham took more away fans to their game than City did.
However, its possible early games had a big away City following, including the visit to Rochdale on 24/04/1993. Between March 20 and May 8 1993, Rochdale had 3 other Saturday home games. In total, the attendance at those 3 games was 4,921 (average 1,640). The games were Torquay (1,594), Colchester (1,783) and Chesterfield (1,544). The City game on April 24 attracted 3,920, or 2,280 above the 3 games average, so that number (and maybe a few more) might be considered to be the City following. Note, from the 3 game analysis, midweek games against Barnet and local rivals Bury are excluded. However, official figures state 2,049, albeit in an era when segregation wasn't always robust. Local derbies at Hull (25/01/2003 and 07/02/2004) are also thought to have attracted large City followings but statistical analysis is unhelpful in estimating City fan numbers present.
All City’s Wembley appearances will have attracted large City followings, believed to be between about 9,000 and 12,000 per game.
However, the biggest crowds to have watched City games away from York are memorable FA Cup games, in those days there was no reporting of away fan attendance, suffice to say for the Hillsborough FA Cup game it was reported that 20 special trains were laid on to carry City fans and a fleet of buses (69 from 2 companies alone) also departed York with an estimated 21,000 fans supporting City. For the replay, City were allocated 12,000 tickets. These numbers are believed to have surpassed the biggest previous estimated City away following when 11,225 tickets were allocated for the Round 6 game at Notts County in March 1955.
Will we beat the FC Halifax away following again during the 2024/5 season? Maybe Hartlepool, but if we do, I hope our supporters have a better experience there than last season.
Next
x
x